Chapter 1 Prologue: Why data science?
Information is what we want, but data are what we’ve got. The techniques for transforming data into information go back hundreds of years. A good starting point is 1592 with the publication of John Graunt’s weekly “bills of mortality” in London (see Figure 1.1). These “bills” are tabulations—a condensation of data on individual events into a form more readily assimilated by the human reader. Constructing such tabulations was a manual operation.
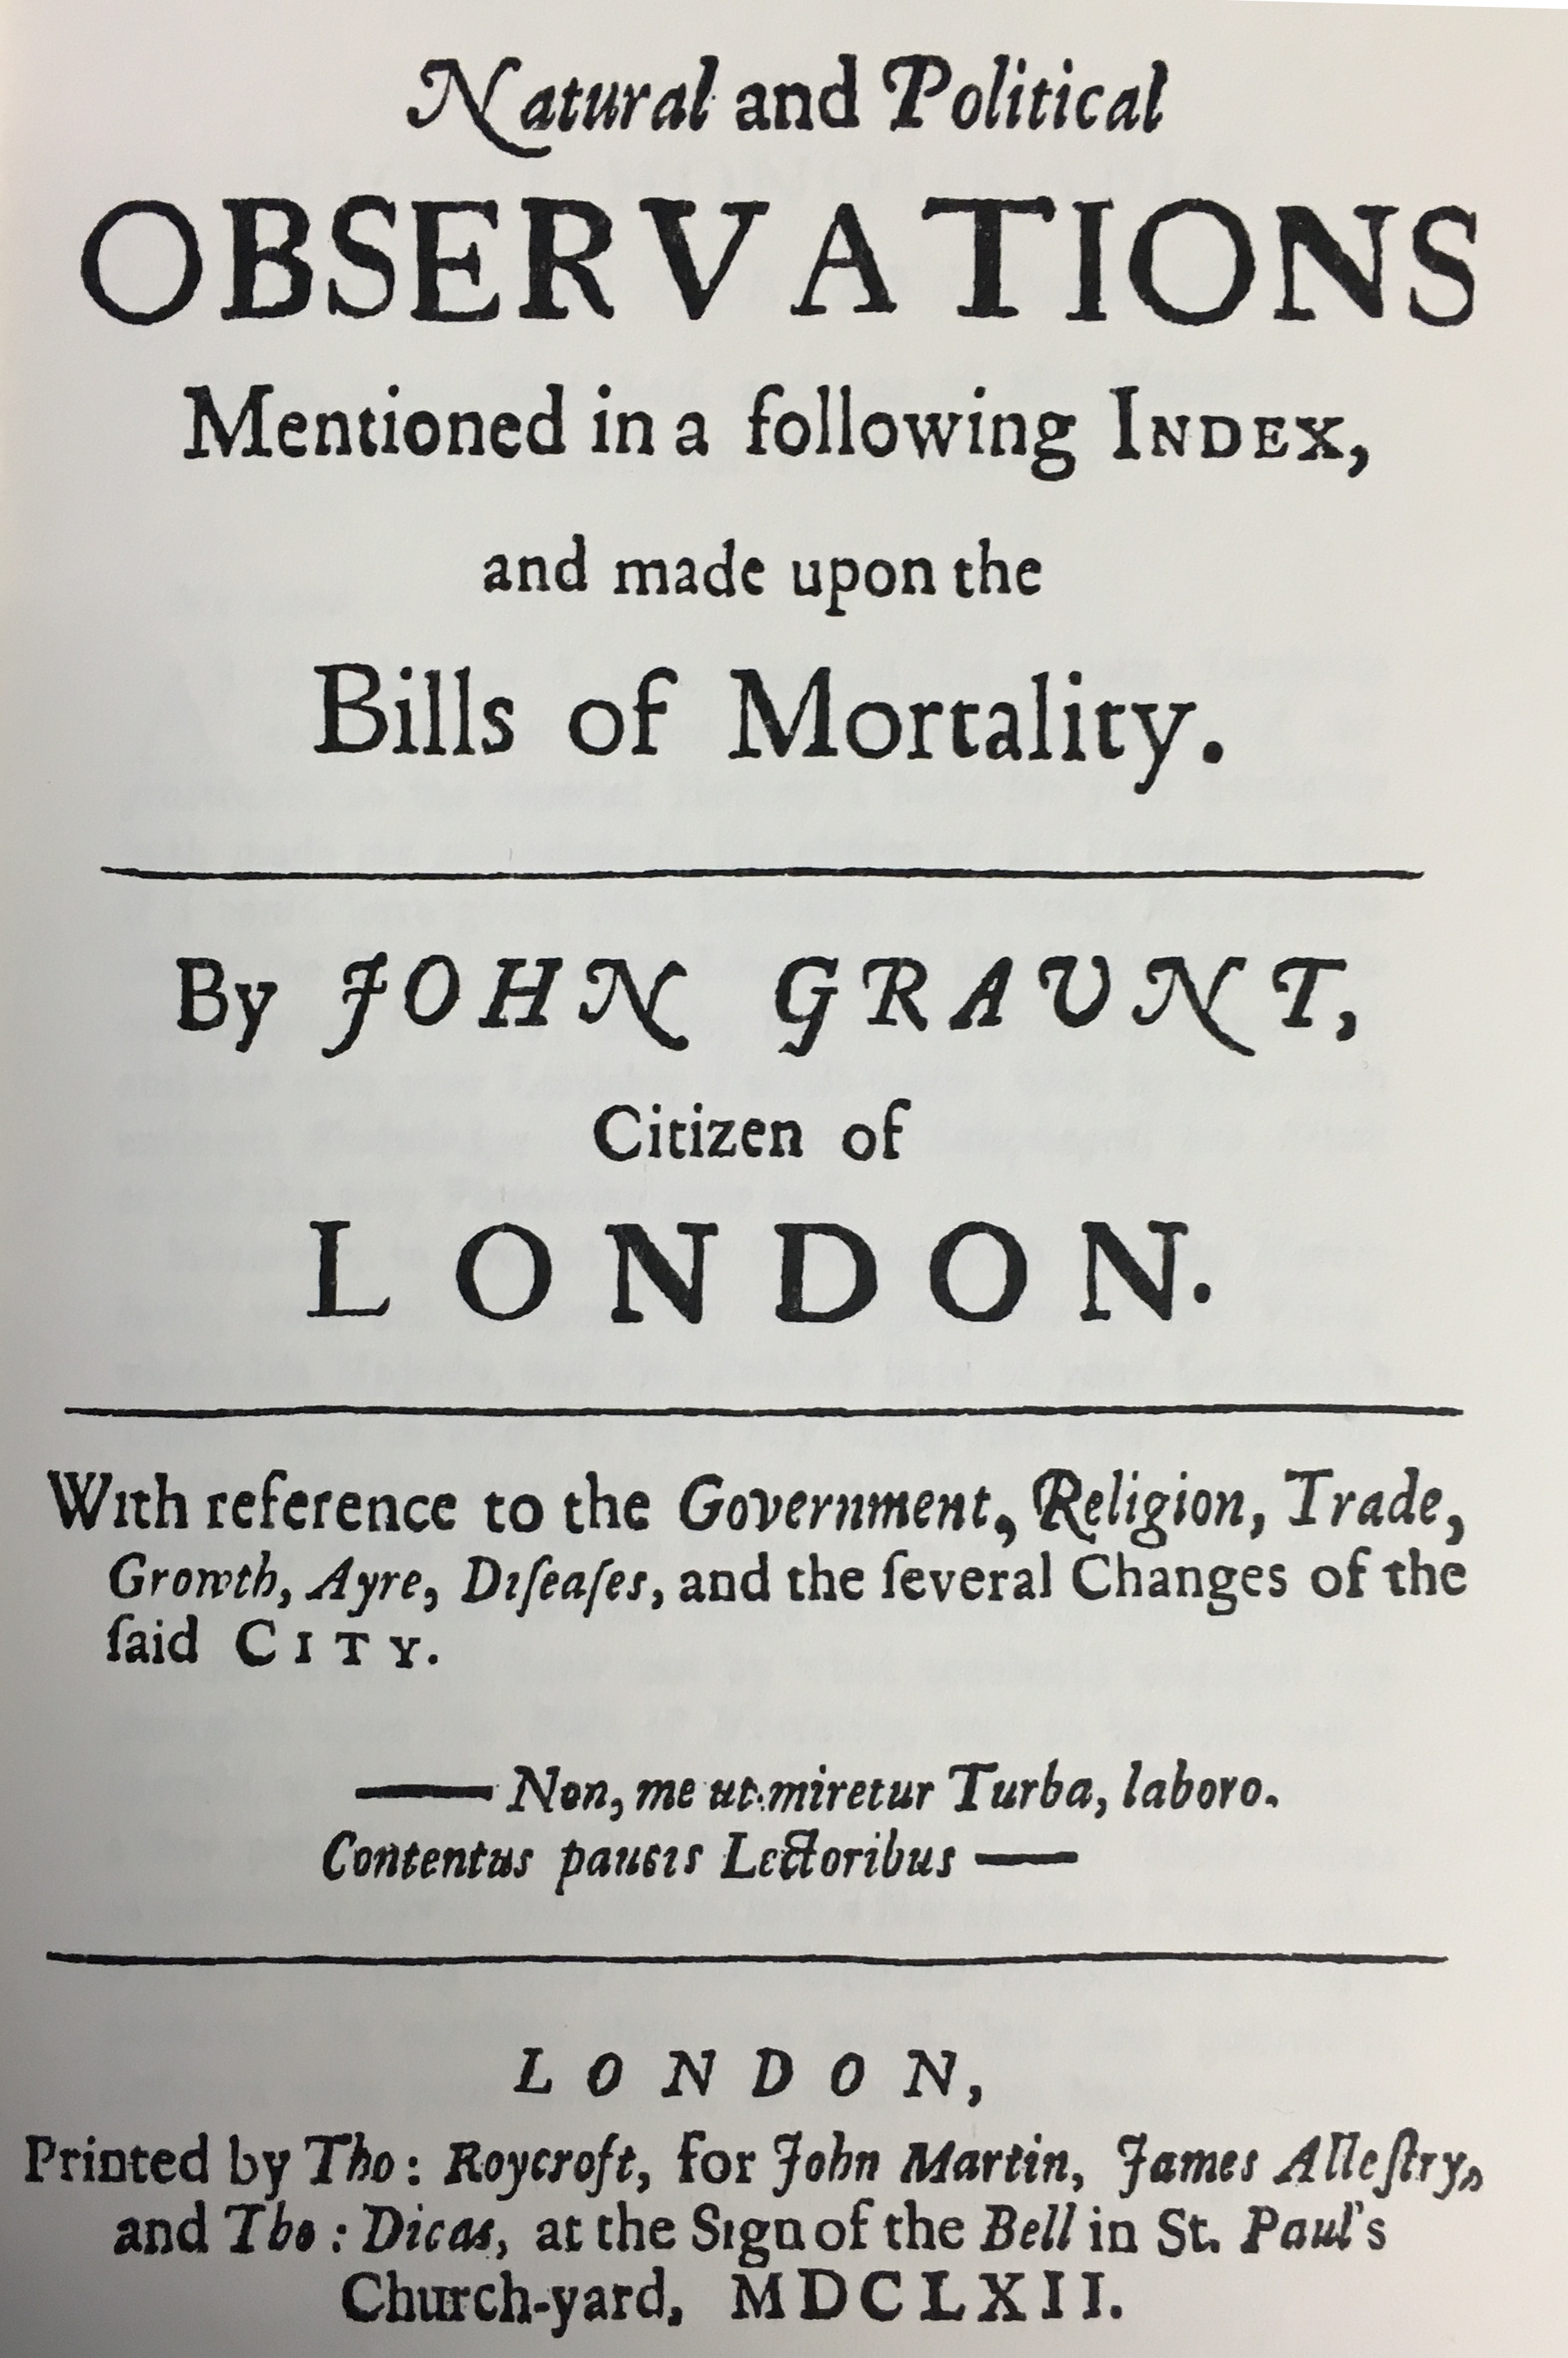
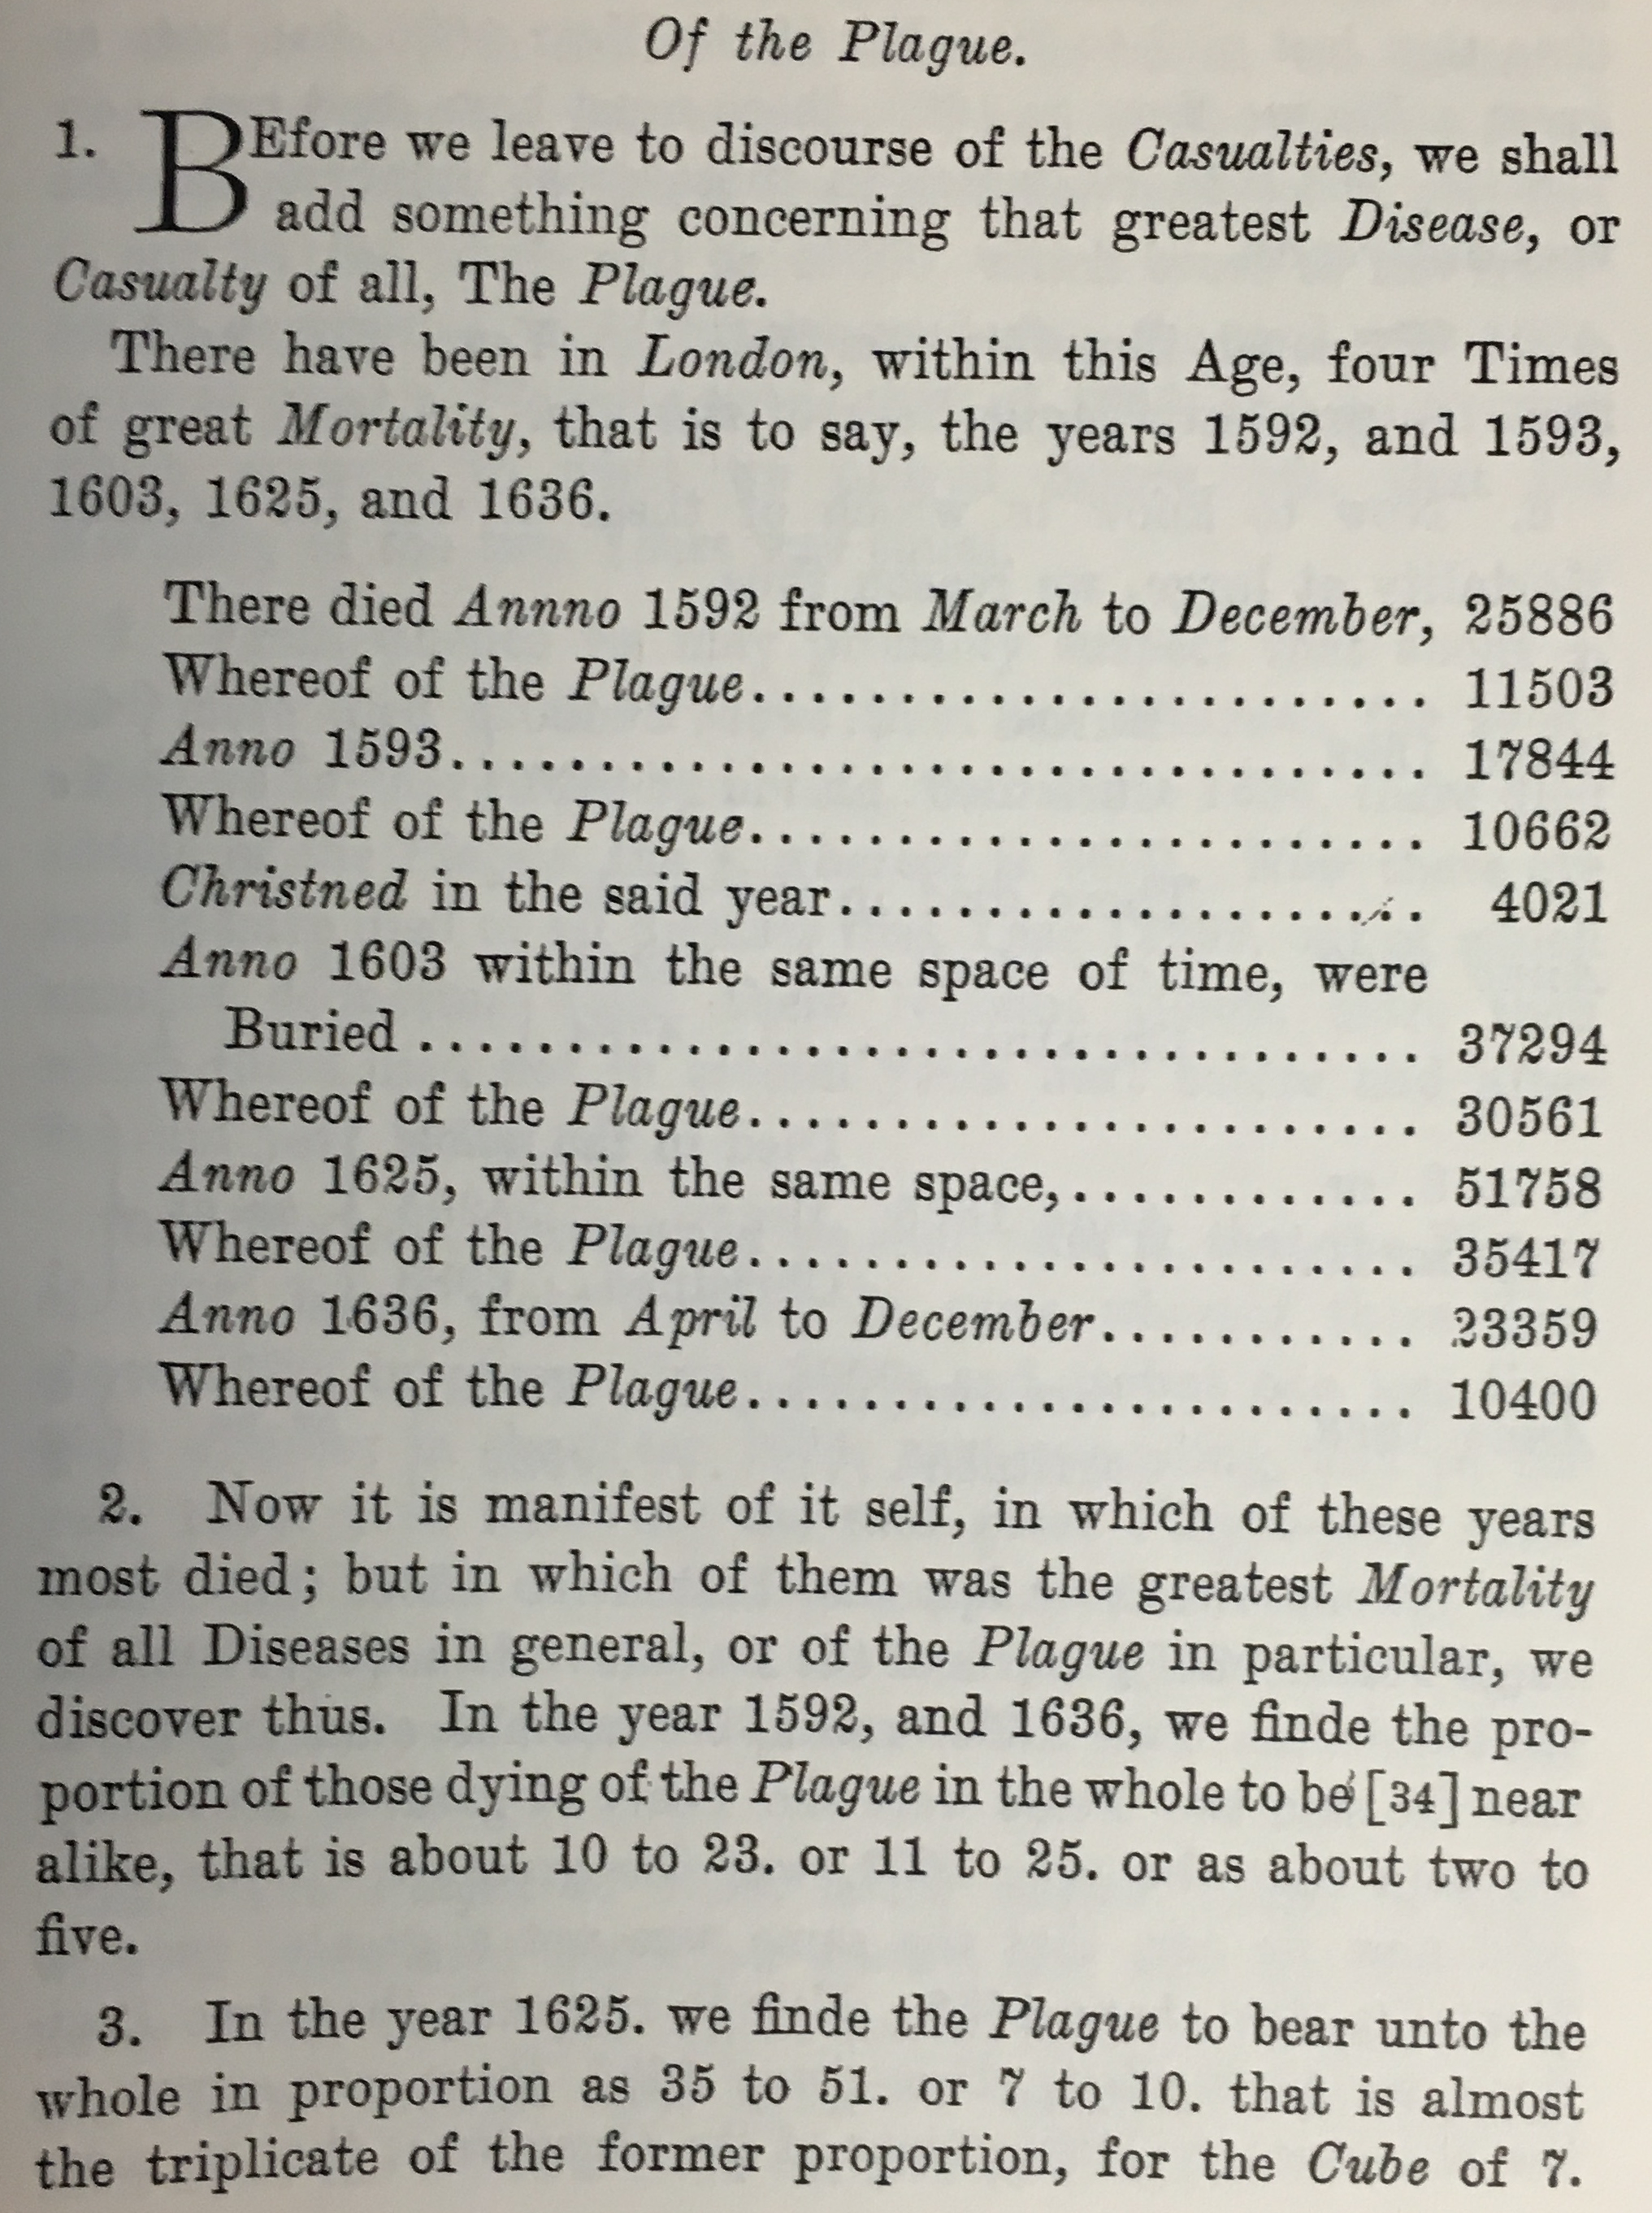
Figure 1.1: Excerpt from Graunt’s bills of mortality. At left, the title page. At right, an excerpt on the plague.
Over the centuries, as data became larger, machines were introduced to speed up the tabulations. A major step was Herman Hollerith’s development of punched cards and an electrical tabulating system for the United States Census of 1890. This was so successful that Hollerith started a company, International Business Machines Corporation (IBM), that came to play an important role in the development of today’s electronic computers.
Also in the late 19th century, statistical methods began to develop rapidly. These methods have been tremendously important in interpreting data, but they were not intrinsically tied to mechanical data processing. Generations of students have learned to carry out statistical operations by hand on small sets of data.
Nowadays, it is common to have data sets that are so large they can be processed only by machine. In this era of big data, data are amassed by networks of instruments and computers. The settings where such data arise are diverse: the genome, satellite observations of Earth, entries by Web users, sales transactions, etc. There are new opportunities for finding and characterizing patterns using techniques described as data mining, machine learning, data visualization, and so on. Such techniques require computer processing. Among the tasks that need performing are data cleaning, combining data from multiple sources, and reshaping data into a form suitable as input to data-summarization operations for visualization and modeling.
In writing this book we hope to help people gain the understanding and skills for data wrangling (a process of preparing data for visualization and other modern techniques of statistical interpretation) and using those data to answer statistical questions via modeling and visualization. Doing so inevitably involves, at the center, the ability to reason statistically and utilize computational and algorithmic capacities.
The National Academies “Data Science for Undergraduates” consensus report (National Academies of Science, Engineering, and Medicine 2018) noted that the vital new field of data science spans a wide range of capacities that they described as “data acumen.” Key components that are part of data acumen include mathematical, computational, and statistical foundations, data management and curation, data description and visualization, data modeling and assessment, workflow and reproducibility, communication and teamwork, domain-specific considerations, and ethical problem solving. They suggested that all students would benefit from “awareness and competence” in data science.
Is an extended study of computer programming necessary to engage in sophisticated computing? Our view is that it is not.
First, over the last half century, a coherent set of simple data operations have been developed that can be used as the building blocks of sophisticated data wrangling processes. The trick is not mastering programming but rather learning to think in terms of these operations. Much of this book is intended to help you master such thinking. Moreover, while data science involves programming, it is more than just programming.
Second, it is possible to use recent developments in software to vastly reduce the amount of programming needed to use these data operations. We have drawn on such software—particularly R and the packages dplyr and ggplot2—to focus on a small subset of functions that accomplish data wrangling tasks in a concise and expressive way. The programming syntax is consistent enough that with a little practice you should be able to adapt the code contained in this book to solve your own problems. (Experienced R programmers will note the distinctive style of R statements in this book, including a consistent focus on a small set of functions and extensive use of the “pipe” operator.) Part I of this book focuses on data wrangling and data visualization as key building blocks for data science.
1.1 What is data science?
We hold a broad view of data science—we see it as the science of extracting meaningful information from data. There are several key ideas embedded in that simple definition. First, data science is a science, a rigorous discipline combining elements of statistics and computer science, with roots in mathematics. Michael I. Jordan from the University of California, Berkeley has described data science as a fine-grained blend of intellectual traditions from statistics and computer science:
Computer science is more than just programming; it is the creation of appropriate abstractions to express computational structures and the development of algorithms that operate on those abstractions. Similarly, statistics is more than just collections of estimators and tests; it is the interplay of general notions of sampling, models, distributions and decision-making. [Data science] is based on the idea that these styles of thinking support each other (Pierson 2016).
Second, data science is best applied in the context of expert knowledge about the domain from which the data originate. This domain might be anything from astronomy to zoology; business and health care are two particularly important domain areas. Third, the distinction between data and information is the raison d’etre of data science. Data scientists are people who are interested in converting the data that is now abundant into actionable information that always seems to be scarce.
Some statisticians might say: “But we already have a field for that: it’s called statistics!” The goals of data scientists and statisticians are the same: They both want to extract meaningful information from data. Much of statistical technique was originally developed in an environment where data were scarce and difficult or expensive to collect, so statisticians focused on creating methods that would maximize the strength of inference one is able to make, given the least amount of data. These techniques were often ingenious, involved sophisticated mathematics, and have proven invaluable to the empirical sciences for going on a century. While several of the most influential early statisticians saw computing as an integral part of statistics, it is also true that much of the development of statistical theory was to find mathematical approximations for things that we couldn’t yet compute (Cobb 2007).
Today, the manner in which we extract meaning from data is different in two ways—both due primarily to advances in computing:
- we are able to compute many more things than we could before, and,
- we have a lot more data than we had before.
The first change means that some of the techniques that were ubiquitous in statistics education in the 20th century (e.g., the t-test, ANOVA) are being replaced by computational techniques that are conceptually simpler but were simply infeasible until the microcomputer revolution (e.g., the bootstrap, permutation tests). The second change means that many of the data we now collect are observational—they don’t come from a designed experiment, and they aren’t really sampled at random. This makes developing realistic probability models for these data much more challenging, which in turn makes formal statistical inference a more challenging (and perhaps less relevant) problem. In some settings (e.g., clinical trials and A/B tests) the careful estimation of a model parameter using inferential statistical methods is still the primary goal. But in an array of academic, government, and industrial settings, the end result may instead be a predictive model, an interactive visualization of the data, or a web application that allows the user to engage with the data to explore questions and extract meaning. We explore issues related to statistical inference and modeling in greater depth in Part II of this book.
The increasing complexity and heterogeneity of modern data means that each data analysis project needs to be custom-built. Simply put, the modern data analyst needs to be able to read and write computer instructions, the “code” from which data analysis projects are built. Part I of this book develops foundational abilities in data visualization and data wrangling—two essential skills for the modern data scientist. These chapters focus on the traditional two-dimensional representation of data: rows and columns in a data table, and horizontal and vertical in a data graphic. In Part III, we explore a variety of non-traditional data types (e.g., geospatial, text, network, “big”) and interactive data graphics.
As you work through this book, you will develop computational skills that we describe as “precursors” to big data (Horton, Baumer, and Wickham 2015). In Chapter 21, we point to some tools for working with truly big data. One has to learn to crawl before one can walk, and we argue that for most people the skills developed herein are more germane to the kinds of problems that you are likely to encounter.
1.2 Case study: The evolution of sabermetrics
The evolution of baseball analytics (often called sabermetrics) in many ways recapitulates the evolution of analytics in other domains. Although domain knowledge is always useful in data science, no background in baseball is required for this section.1
The use of statistics in baseball has a long and storied history—in part because the game itself is naturally discrete, and in part because Henry Chadwick began publishing boxscores in the early 1900s (Schwarz 2005). For these reasons, a rich catalog of baseball data began to accumulate.
However, while more and more baseball data were piling up, analysis of that data was not so prevalent. That is, the extant data provided a means to keep records, and as a result some numerical elements of the game’s history took on a life of their own (e.g., Babe Ruth’s 714 home runs). But it is not as clear how much people were learning about the game of baseball from the data. Knowing that Babe Ruth hit more home runs than Mel Ott tells us something about two players, but doesn’t provide any insight into the nature of the game itself.
In 1947—Jackie Robinson‘s rookie season—Brooklyn Dodgers’ general manager Branch Rickey made another significant innovation: He hired Allan Roth to be baseball’s first statistical analyst. Roth’s analysis of baseball data led to insights that the Dodgers used to win more games. In particular, Roth convinced Rickey that a measurement of how often a batter reaches first base via any means (e.g., hit, walk, or being hit by the pitch) was a better indicator of that batter’s value than how often he reaches first base via a hit (which was—and probably still is—the most commonly cited batting statistic). The logic supporting this insight was based on both Roth’s understanding of the game of baseball (what we call domain knowledge) and his statistical analysis of baseball data.
During the next 50 years, many important contributions to baseball analytics were made by a variety of people, most notably “The Godfather of Sabermetrics” Bill James (B. James 1986). Most of these sabermetricians had little formal training in statistics. Their tool of choice was often a spreadsheet. They were able to use their creativity, domain knowledge, and a keen sense of what the interesting questions were to make ground-breaking discoveries.
The 2003 publication of Moneyball (Lewis 2003)—which showcased how Billy Beane and Paul DePodesta used statistical analysis to run the Oakland A’s—triggered a revolution in how front offices in baseball were managed (B. S. Baumer and Zimbalist 2014). Over the next decade, the size of the data expanded so rapidly that a spreadsheet was no longer a viable mechanism for storing—let alone analyzing—all of the available data. Today, many professional sports teams have research and development groups headed by people with Ph.D.’s in statistics or computer science along with graduate training in machine learning (B. Baumer 2015). This is not surprising given that revenue estimates for major league baseball top $8 billion per year.
The contributions made by the next generation of baseball analysts will require coding ability. The creativity and domain knowledge that fueled the work of Allan Roth and Bill James remain necessary traits for success, but they are no longer sufficient. There is nothing special about baseball in this respect—a similar profusion of data are now available in many other areas, including astronomy, health services research, genomics, and climate change, among others. For data scientists of all application domains, creativity, domain knowledge, and technical ability are absolutely essential.
1.3 Datasets
There are many data sets used in this book. The smaller ones are available through either the mdsr (see Appendix A) or mosaicData packages. Some other data used in this book are pulled directly from the internet—URLs for these data are embedded in the text. There are a few larger, more complicated data sets that we use repeatedly and that warrant some explication here.
- Airline Delays: The United States Bureau of Transportation Statistics has collected data on more than 169 million domestic flights dating back to October 1987. These data were used for the 2009 ASA Data Expo (H. Wickham 2011) (a subset are available in the MySQL database we have made available through the mdsr package). The nycflights13 package contains a proper subset of these data (flights leaving the three most prominent New York City airports in 2013).
- Baseball: The Lahman database is maintained by Sean Lahman, a database journalist. Compiled by a team of volunteers, it contains complete seasonal records going back to 1871 and is usually updated yearly. It is available for download both as a pre-packaged SQL file and as an R package (Friendly et al. 2021).
- Baby Names: The babynames package for R provides data about the popularity of individual baby names from the United States Social Security Administration (Hadley Wickham 2019b). These data can be used, for example, to track the popularity of certain names over time.
- Federal Election Commission: The fec package (Benjamin S. Baumer and Gjekmarkaj 2017) provides access to campaign spending data for recent federal elections maintained by the Federal Election Commission. These data include contributions by individuals to committees, spending by those committees on behalf, or against individual candidates for president, the Senate, and the House of Representatives, as well information about those committees and candidates. The fec12 and fec16 packages provide that information for single election cycles in a simplified form (R-fec16?).
- MacLeish: The Ada and Archibald MacLeish field station is a 260-acre plot of land owned and operated by Smith College. It is used by faculty, students, and members of the local community for environmental research, outdoor activities, and recreation. The macleish package allows you to download and process weather data as a time series from the MacLeish Field Station using the etl framework (Benjamin S. Baumer et al. 2020). It also contains shapefiles for contextualizing spatial information.
- Movies: The Internet Movie Database is a massive repository of information about movies (IMDB.com 2013). The easiest way to get the IMDb data into SQL is by using the open-source
IMDbPYPython package (Alberani 2014). - Restaurant Violations: The mdsr package contains data on restaurant health inspections made by the New York City Health Department.
1.4 Further resources
Each chapter features a list of additional resources that serve as a definitive reference for a given topic, provide further detail, or suggest additional material to explore. Definitions of data science and data analytics abound. See Donoho (2017), De Veaux et al. (2017), Cobb (2015), Horton and Hardin (2015), Hardin et al. (2015), Finzer (2013), Provost and Fawcett (2013), and Cleveland (2001) for some examples. More information regarding the components of data acumen can be found in National Academies of Science, Engineering, and Medicine (2018).
The main rules of baseball are these: Two teams of nine players alternate trying to score runs on a field with four bases (first base, second base, third base, and home). The defensive team pitches while one member of the offensive team bats while standing by home base. A run is scored when an offensive player crosses home plate after advancing in order through the other bases.↩︎