Exercises

This page includes several sets of online exercises.

Data Visualization

Exercise 2.3

Choose one of the data graphics listed below and answer the following questions. Be sure to indicate which graphical display you picked.

  1. Identify the visual cues, coordinate system, and scale(s).
  2. How many variables are depicted in the graphic? Explicitly link each variable to a visual cue that you listed above.
  3. Critique this data graphic using the taxonomy described in this chapter.
  1. Who does not Pay Income Tax?
  2. World’s Top 10 Best Selling Cigarette Brands, 2004-2007
  3. GNPD Usage by Food Categories
  4. NBA Playoff Rings
  5. UK University Rankings
  6. Childhood Obesity in the US
  7. Relationship between ages and psychosocial maturity
  8. Location of Floating Plastic Trash

Exercise 2.4

Answer the following questions for each of the following collections of data graphics.

  1. What is a Data Scientist?
  2. Charts that explain food in America

Briefly (one paragraph) critique the designer’s choices. Would you have made different choices? Why or why not.

Note: Each link contains a collection of many data graphics, and we don’t expect (or want) you to write a dissertation on each individual graphic. But each collection shares some common stylistic elements. You should comment on a few things that you notice about the design of the collection.

Exercise 2.5

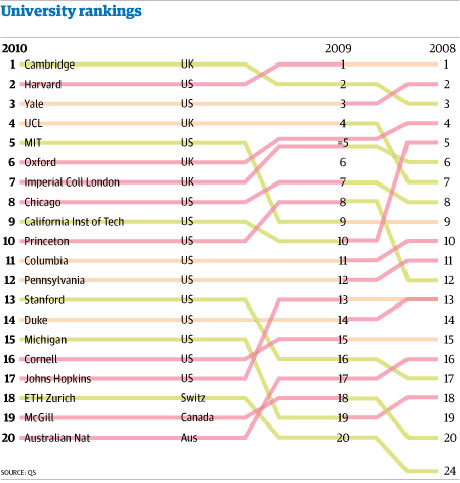
Consider one of the more complicated data graphics listed below.

  1. What story does the data graphic tell? What is the main message that you take away from it?
  2. Can the data graphic be described in terms of the taxonomy presented in this chapter? If so, list the visual cues, coordinate system, and scales(s) as you did in Problem 2(a). If not, describe the feature of this data graphic that lies outside of that taxonomy.
  3. Critique and/or praise the visualization choices made by the designer. Do they work? Are they misleading? Thought-provoking? Brilliant? Are there things that you would have done differently? Justify your response.
  1. Health InfoScape
  2. Career Paths for Williams College alums
  3. Wind Map
  4. Obama’s Budget
  5. Mapping the Epigenome
  6. UK Government Spending
  7. Malte Spitz’s cellphone usage
  8. Wharf 5 Tide Prediction
  9. Wikipedia Changes Map
  10. Programming languages across GitHub
  11. Causes for breast cancer
  12. CitiBike Rebalancing
  13. CO2 Emissions
  14. Circos Genomic Data
  15. Jobs Charted by State and Salary